It is a capital mistake to theorize before one has data. Insensibly one begins to twist facts to suit theories, instead of theories to suit facts.
Sir Arthur Conan Doyle, Author of Sherlock Holmes stories
 |
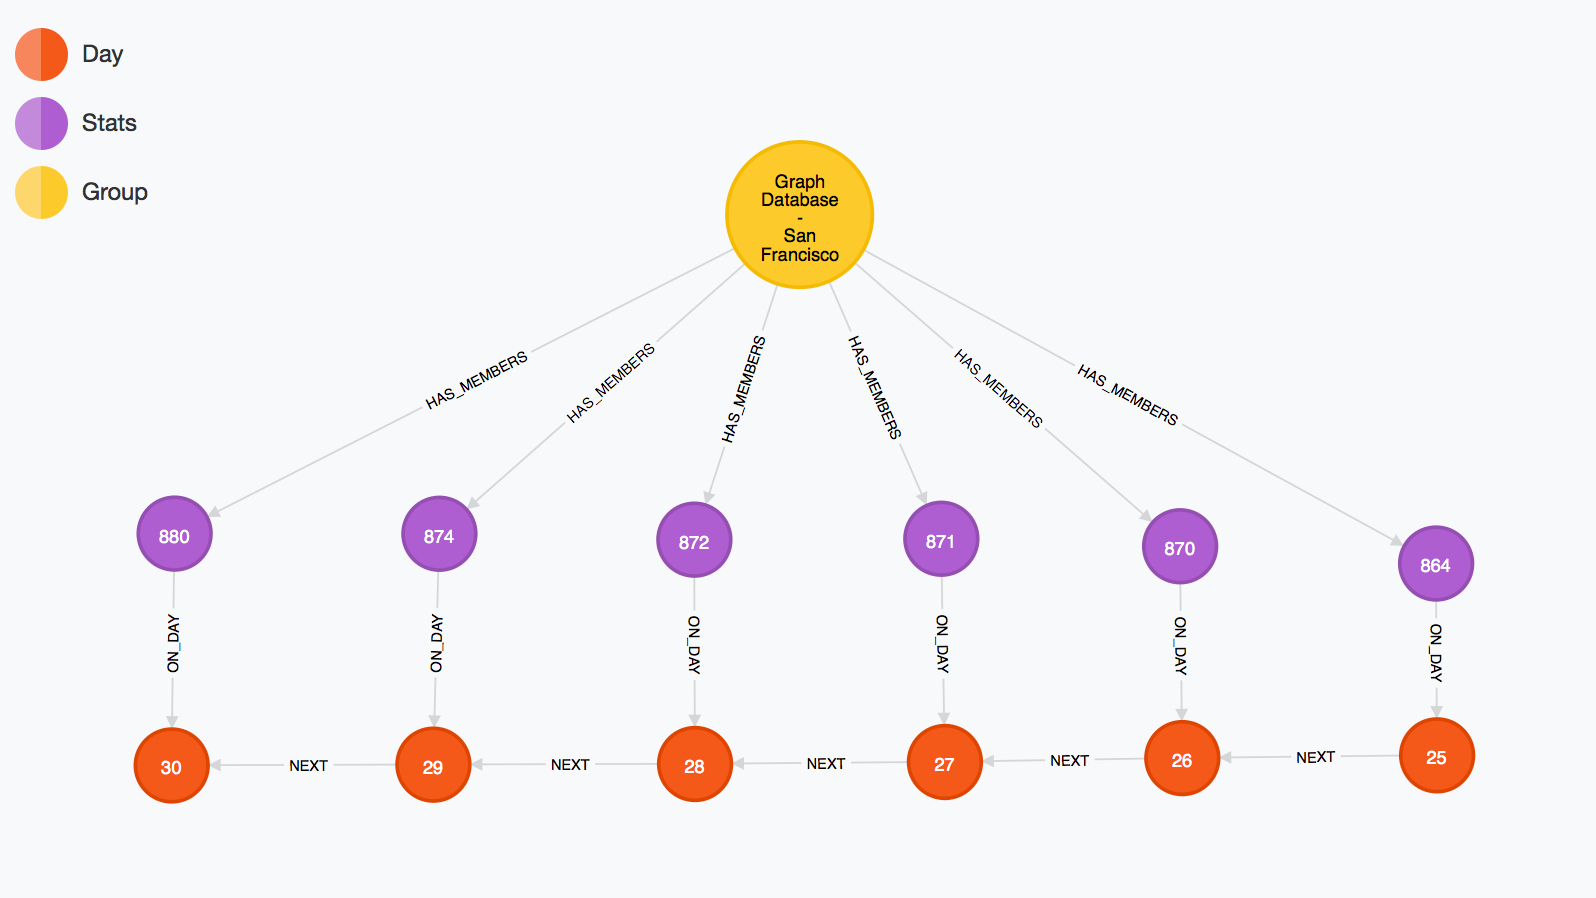
| A Subgraph From Neo4j's Browser |
Just as Sir Arthur Conan Doyle's character, Sherlock Holmes, manically collects facts and evidence to prove theories, we find ourselves doing much of the same today except on a much larger scale
— web scale. The web is an ever growing expanse of facts and evidence. It is at our disposal to observe without much of a challenge, but to store it and retrieve it in a way that answers the big questions, that's challenging.
Continuing on from
Building a Graph-based Reporting Platform: Part I, I posed some questions related to understanding how to build great community experiences around Neo4j using Meetup.com for local events. I presented an idea to use Neo4j to build a platform that could help us understand the demand for presenting compelling content at events.
Compelling content is at the core of great community experiences. That content fuels the conversations between people, ideas begin to flow, and innovation is born.
My idea was to build an open-source platform that would poll public APIs, translate collected data into a graph, and store it in a graph database to be analyzed, queried, and visualized over time. The first component of this architecture is the
Data Import Scheduler, which this post describes in detail.
Polling Data From Public APIs
Let's start out by answering a basic question.
What does the data import scheduler do?
The analytics data import scheduler is a Node.js process that can be hosted for free on Heroku and is responsible for collecting time-based statistics from a public API. In this case, the Meetup.com REST API exposes a set of methods that provide a momentary snapshot into the number of members that a group has at the time of the request. The data import scheduler polls this endpoint once a day to retrieve Meetup group statistics to later be used for time-based analysis from our graph database,
Neo4j.
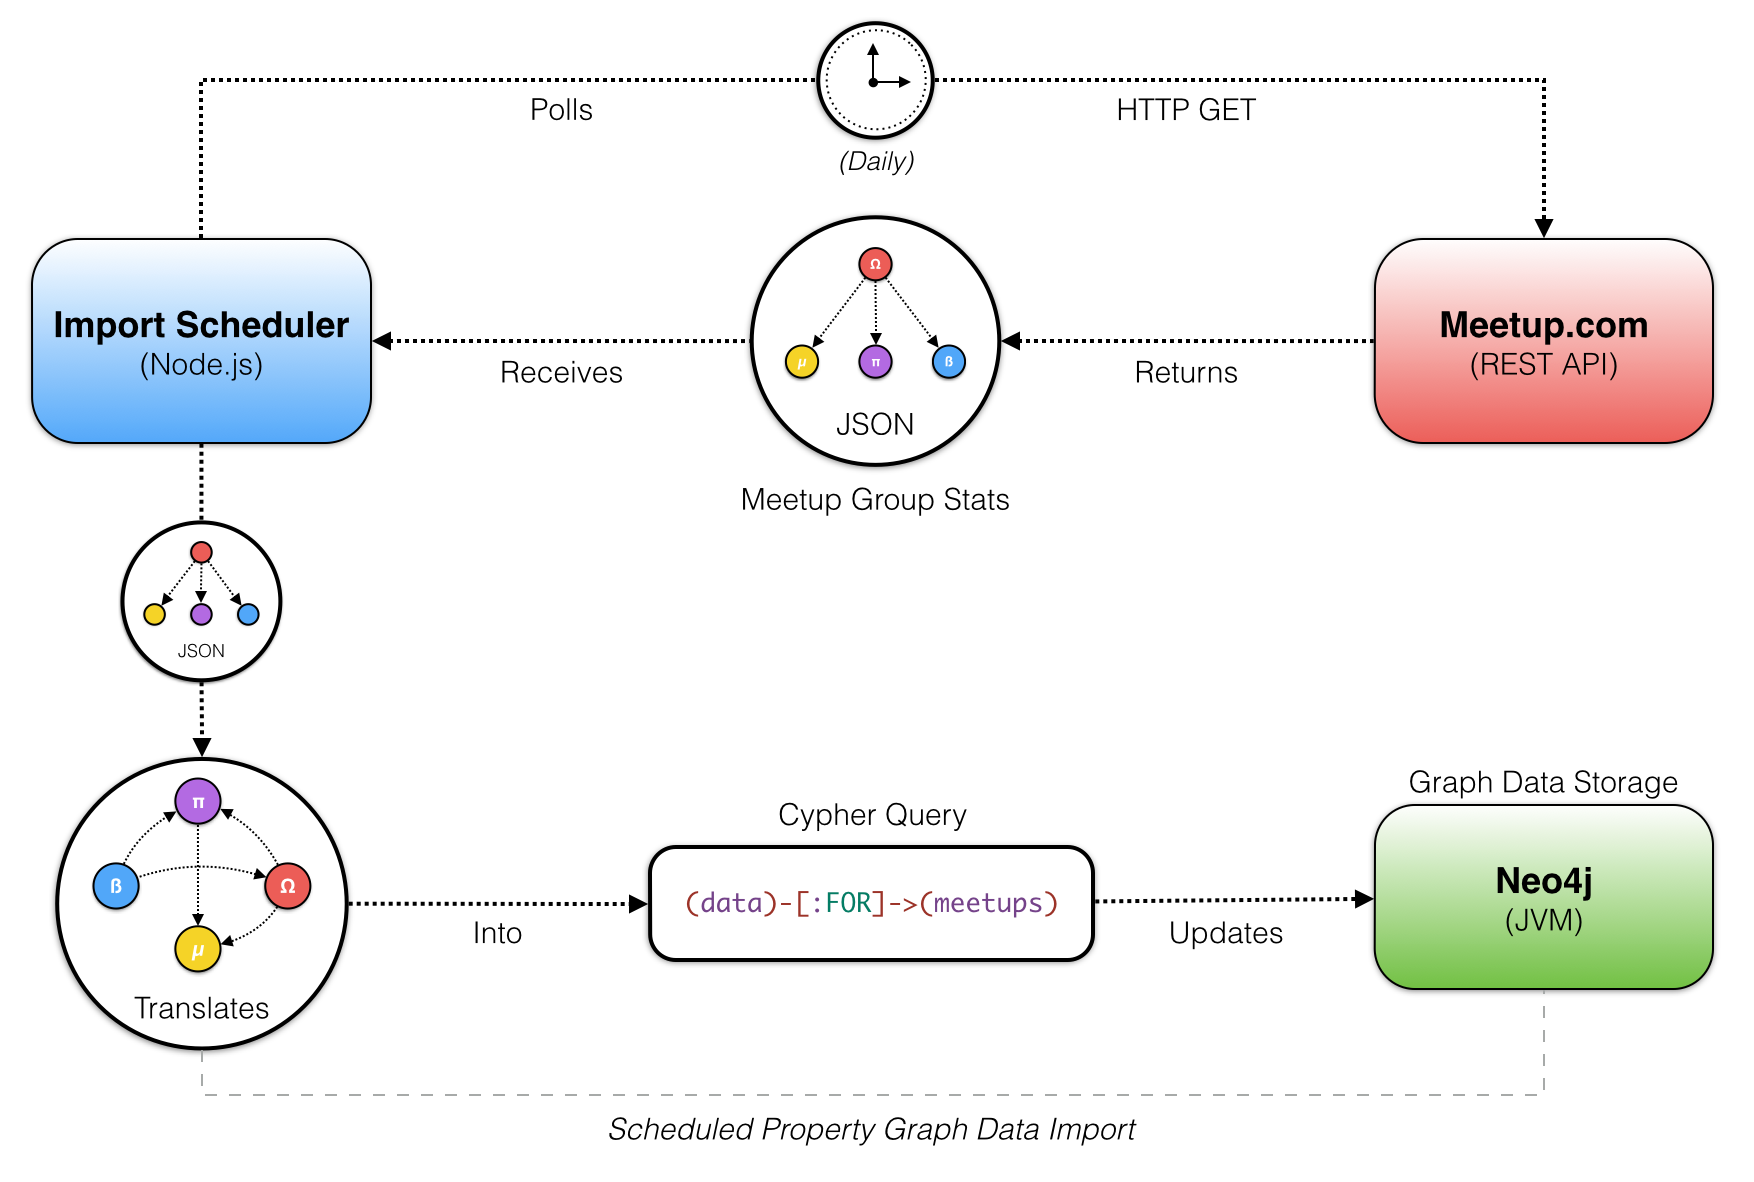
As illustrated in the diagram below, the Node.js application wakes up once a day and checks in with the Meetup.com REST API.
The scheduler process polls Meetup.com's REST API daily. An HTTP GET request is dispatched for each city we're tracking, returning a JSON formatted response for groups in those cities. The JSON data for each group is then translated into a subgraph, formatted as
Neo4j's Cypher query language. The Cypher query is then sent as a transaction to Neo4j and updates a snapshot of the group's stats for that day.
Importing a Meetup Group's Subgraph
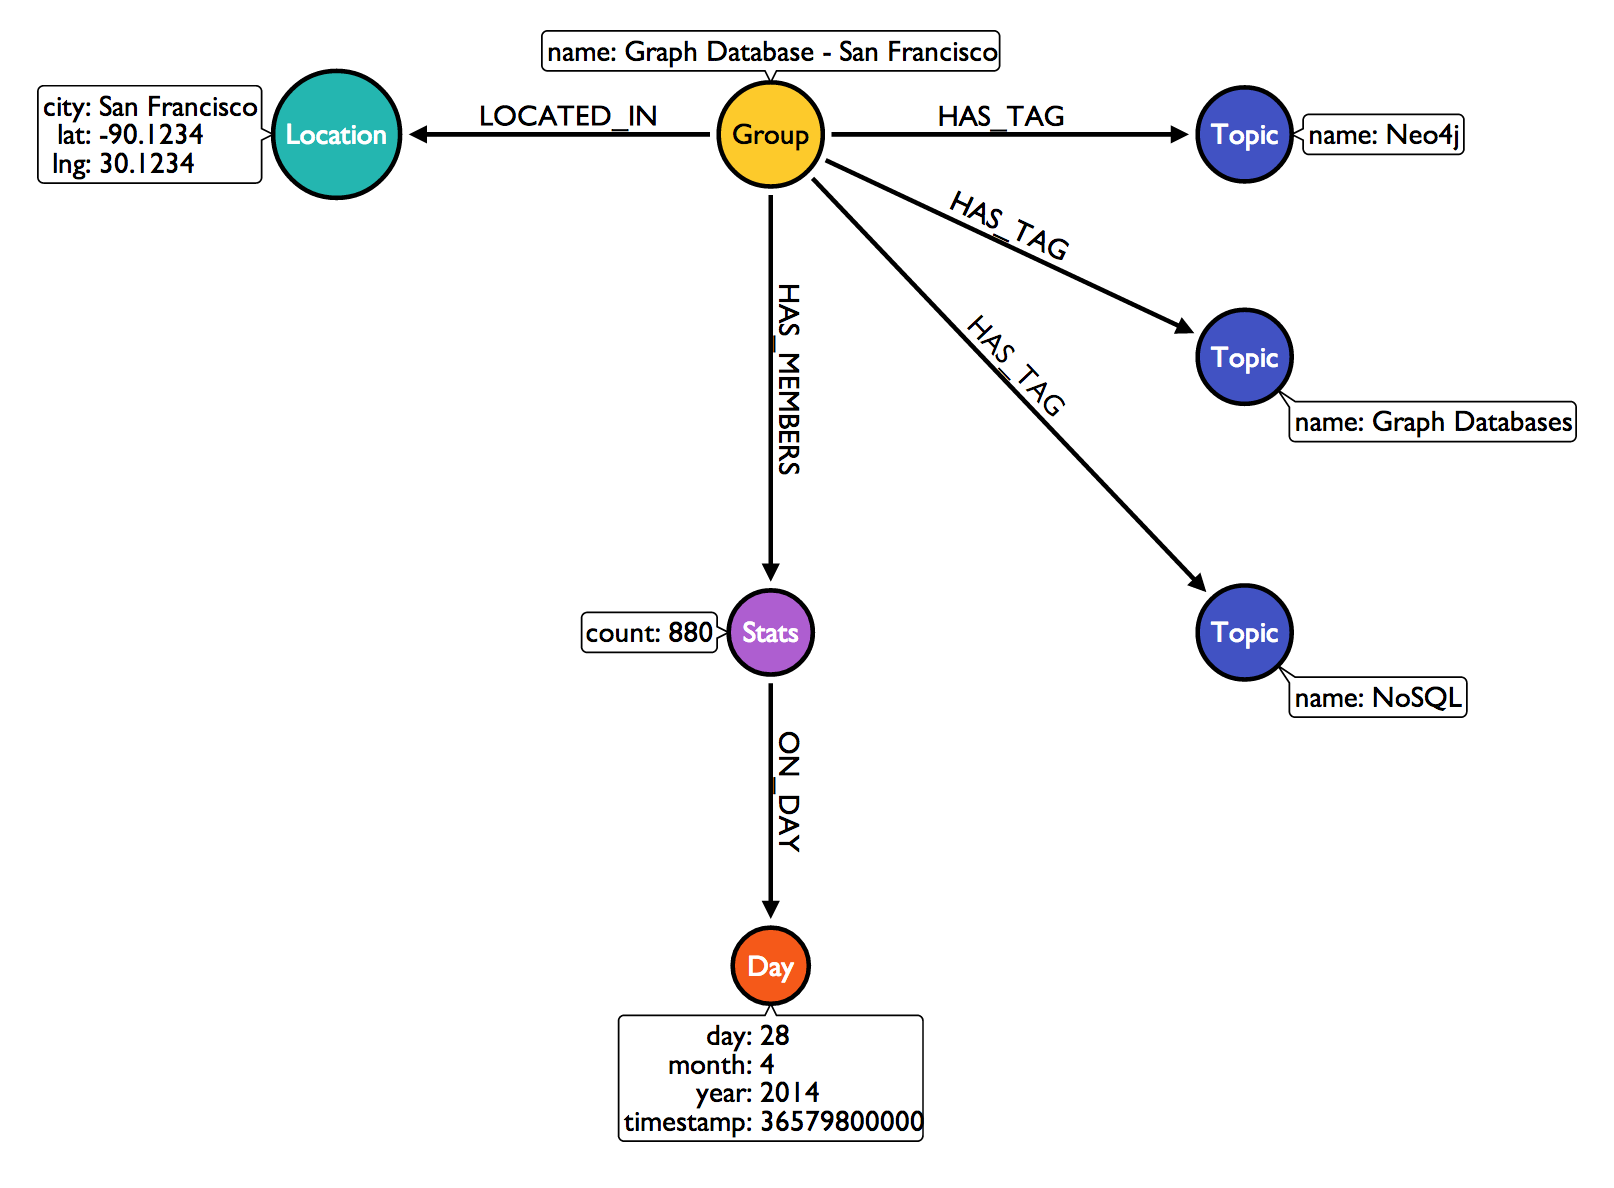
The image below is a visualization of a Meetup group's subgraph, translated from JSON data polled on an arbitrary date.
 |
| Graph Database - San Francisco on 4/28/2014 |
We see that the group has a set of topic nodes, which may already exist within the database. The subgraph must be merged into the larger graph without duplicating any nodes. Using Cypher's
MERGE clause we can get or create nodes, which is useful for expanding our graph's connected data. Each topic will collect more groups as new subgraphs are merged for daily imports. The same is also true for both day and location nodes.
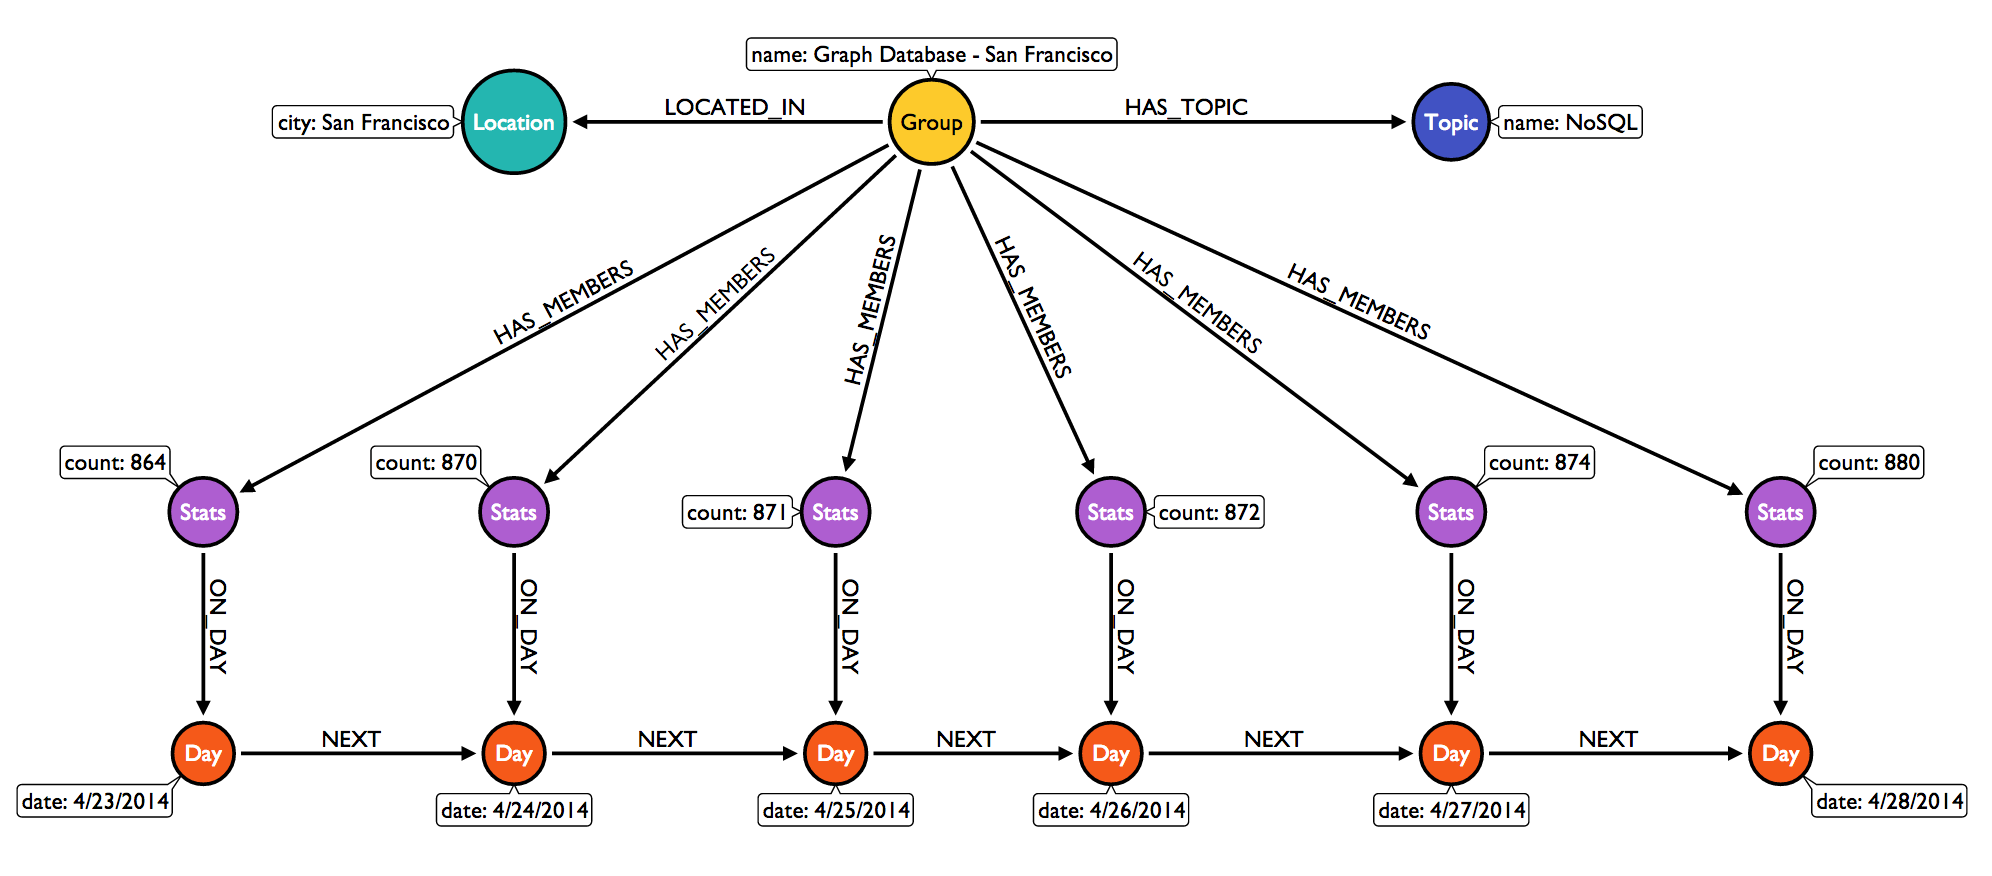
After a few days of scheduled imports, a group's subgraph begins to take shape. As day nodes are connected to the previous day's node, membership statistics are connected.
 |
| A Meetup Group Statistics Subgraph, 4/23 to 4/28 |
The data import scheduler application is open-source and
available on GitHub. Also,
full documentation is available to help you get started with customizing your own graph-based reporting platform.
All analysis on the temporal stats collected from the data import scheduler is performed within the
REST API module of the reporting platform. It also safely exposes the graph database to a front-end web dashboard, consumed from client-side JavaScript. The REST API uses
Swagger, which is a specification and complete framework for describing, producing, consuming, and visualizing RESTful web services.


